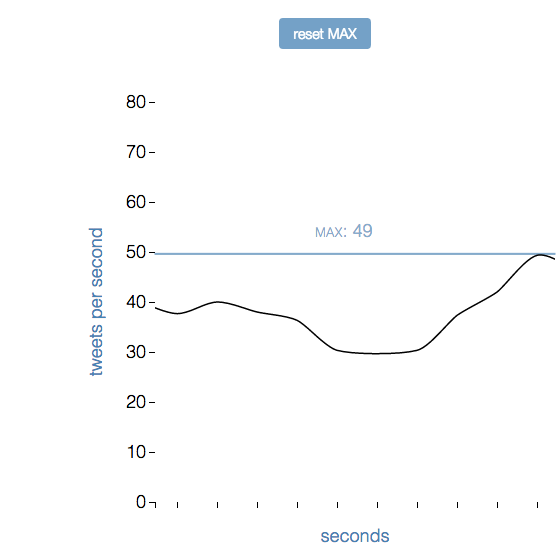
How many tweets?
A simple real-time app using a stream of social media data from nio.js visualized using D3.js.
This chart traces a live stream of data—the number of tweets per second (number is emitted from n.io’s socket room)—and shows the maximum number of tweets per second for the interval since the last refresh or click of the reset button.
A minimal front end with index.html, style.css, and app.js come together to make an informative, interactive app that updates in real time.