Define your root zone interactive soil moisture chart built with D3.js and React
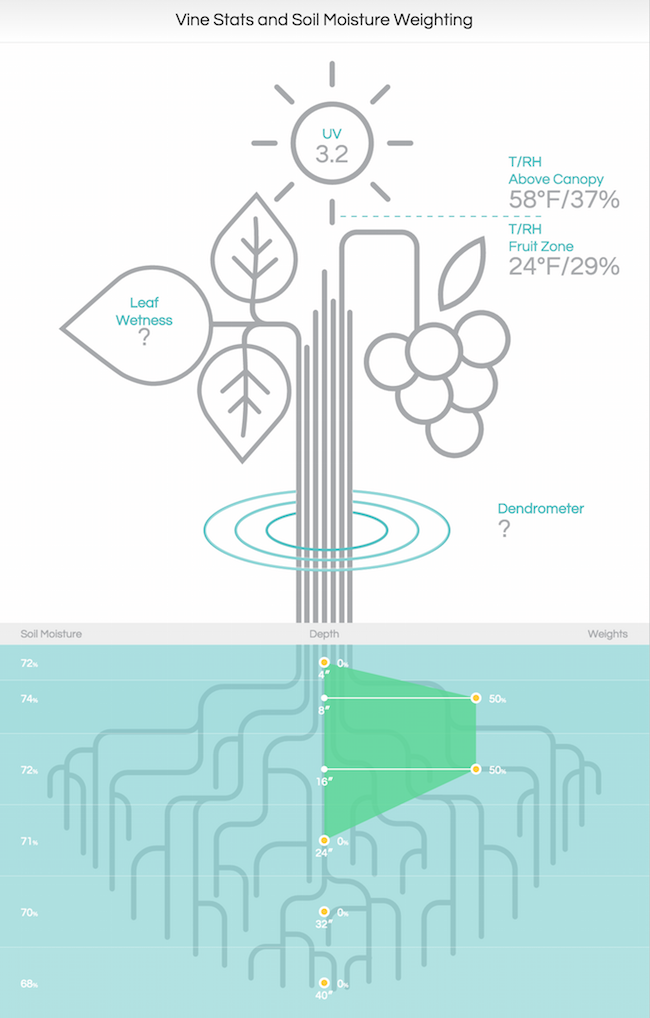
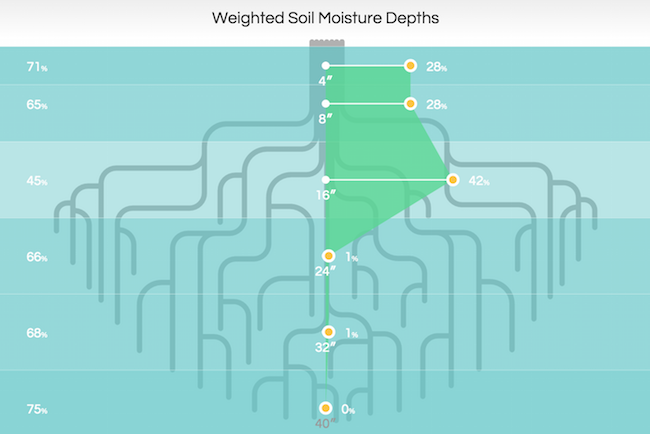
A variation on the stacked bar chart shows the percentage soil moisture at each root depth. Farmers can drag soil-moisture weights for each root depth, indicating the importance of that root depth meeting it’s target soil moisture percentage.
One illustration shows an entire vine visualization.
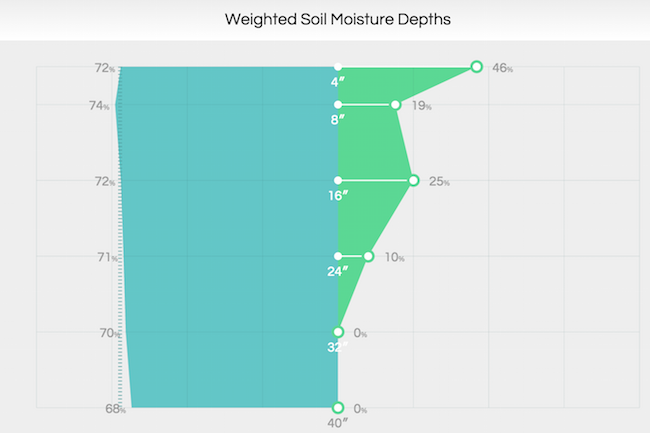
The others are a before and after of the root system with the soil moisture at different depths displayed in two different ways: as distance or as transparency/darkness.
The first root-zone graphic uses relative distance to show both current soil moisture and weighted soil moisture. The second version uses transparency and gives the illusion of looking through the soil at the roots. I created this update to the chart that uses transparency and roots to show soil moisture percentage. The weighted percentages remain as draggable distances from the central axis.