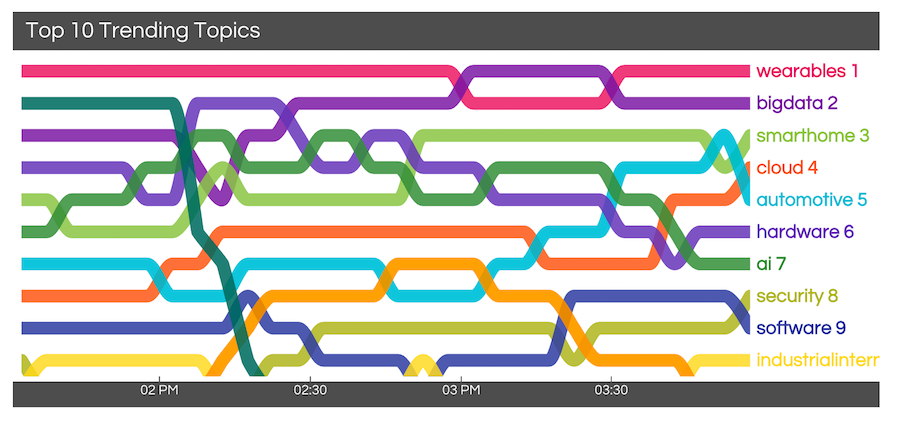
A bump chart shows relative position, or rank, but not a value.
This bump chart used streaming data from multiple social media sources to show trending topics in the internet-of-things arena in real time.
Front-End Developer | All About UX
A bump chart shows relative position, or rank, but not a value.
This bump chart used streaming data from multiple social media sources to show trending topics in the internet-of-things arena in real time.