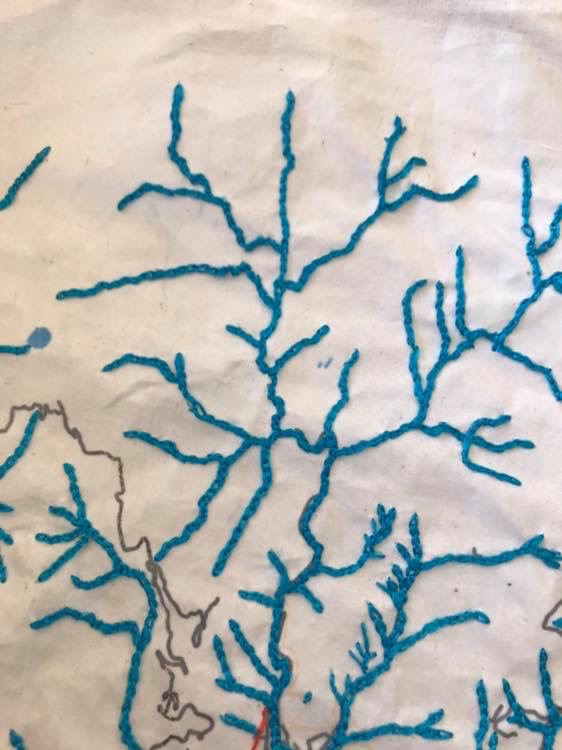
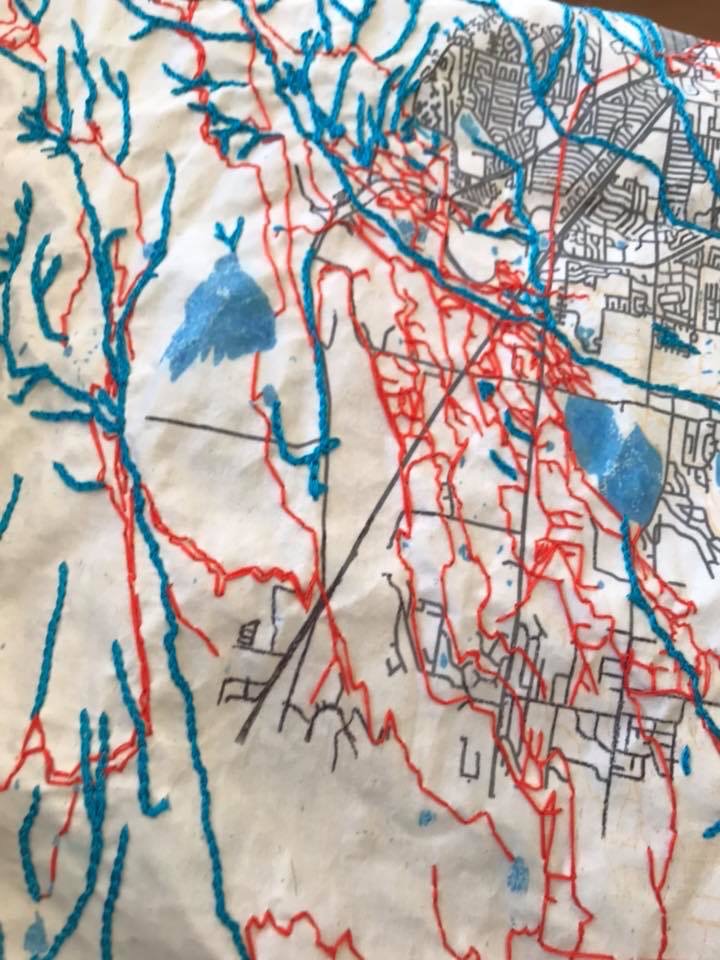
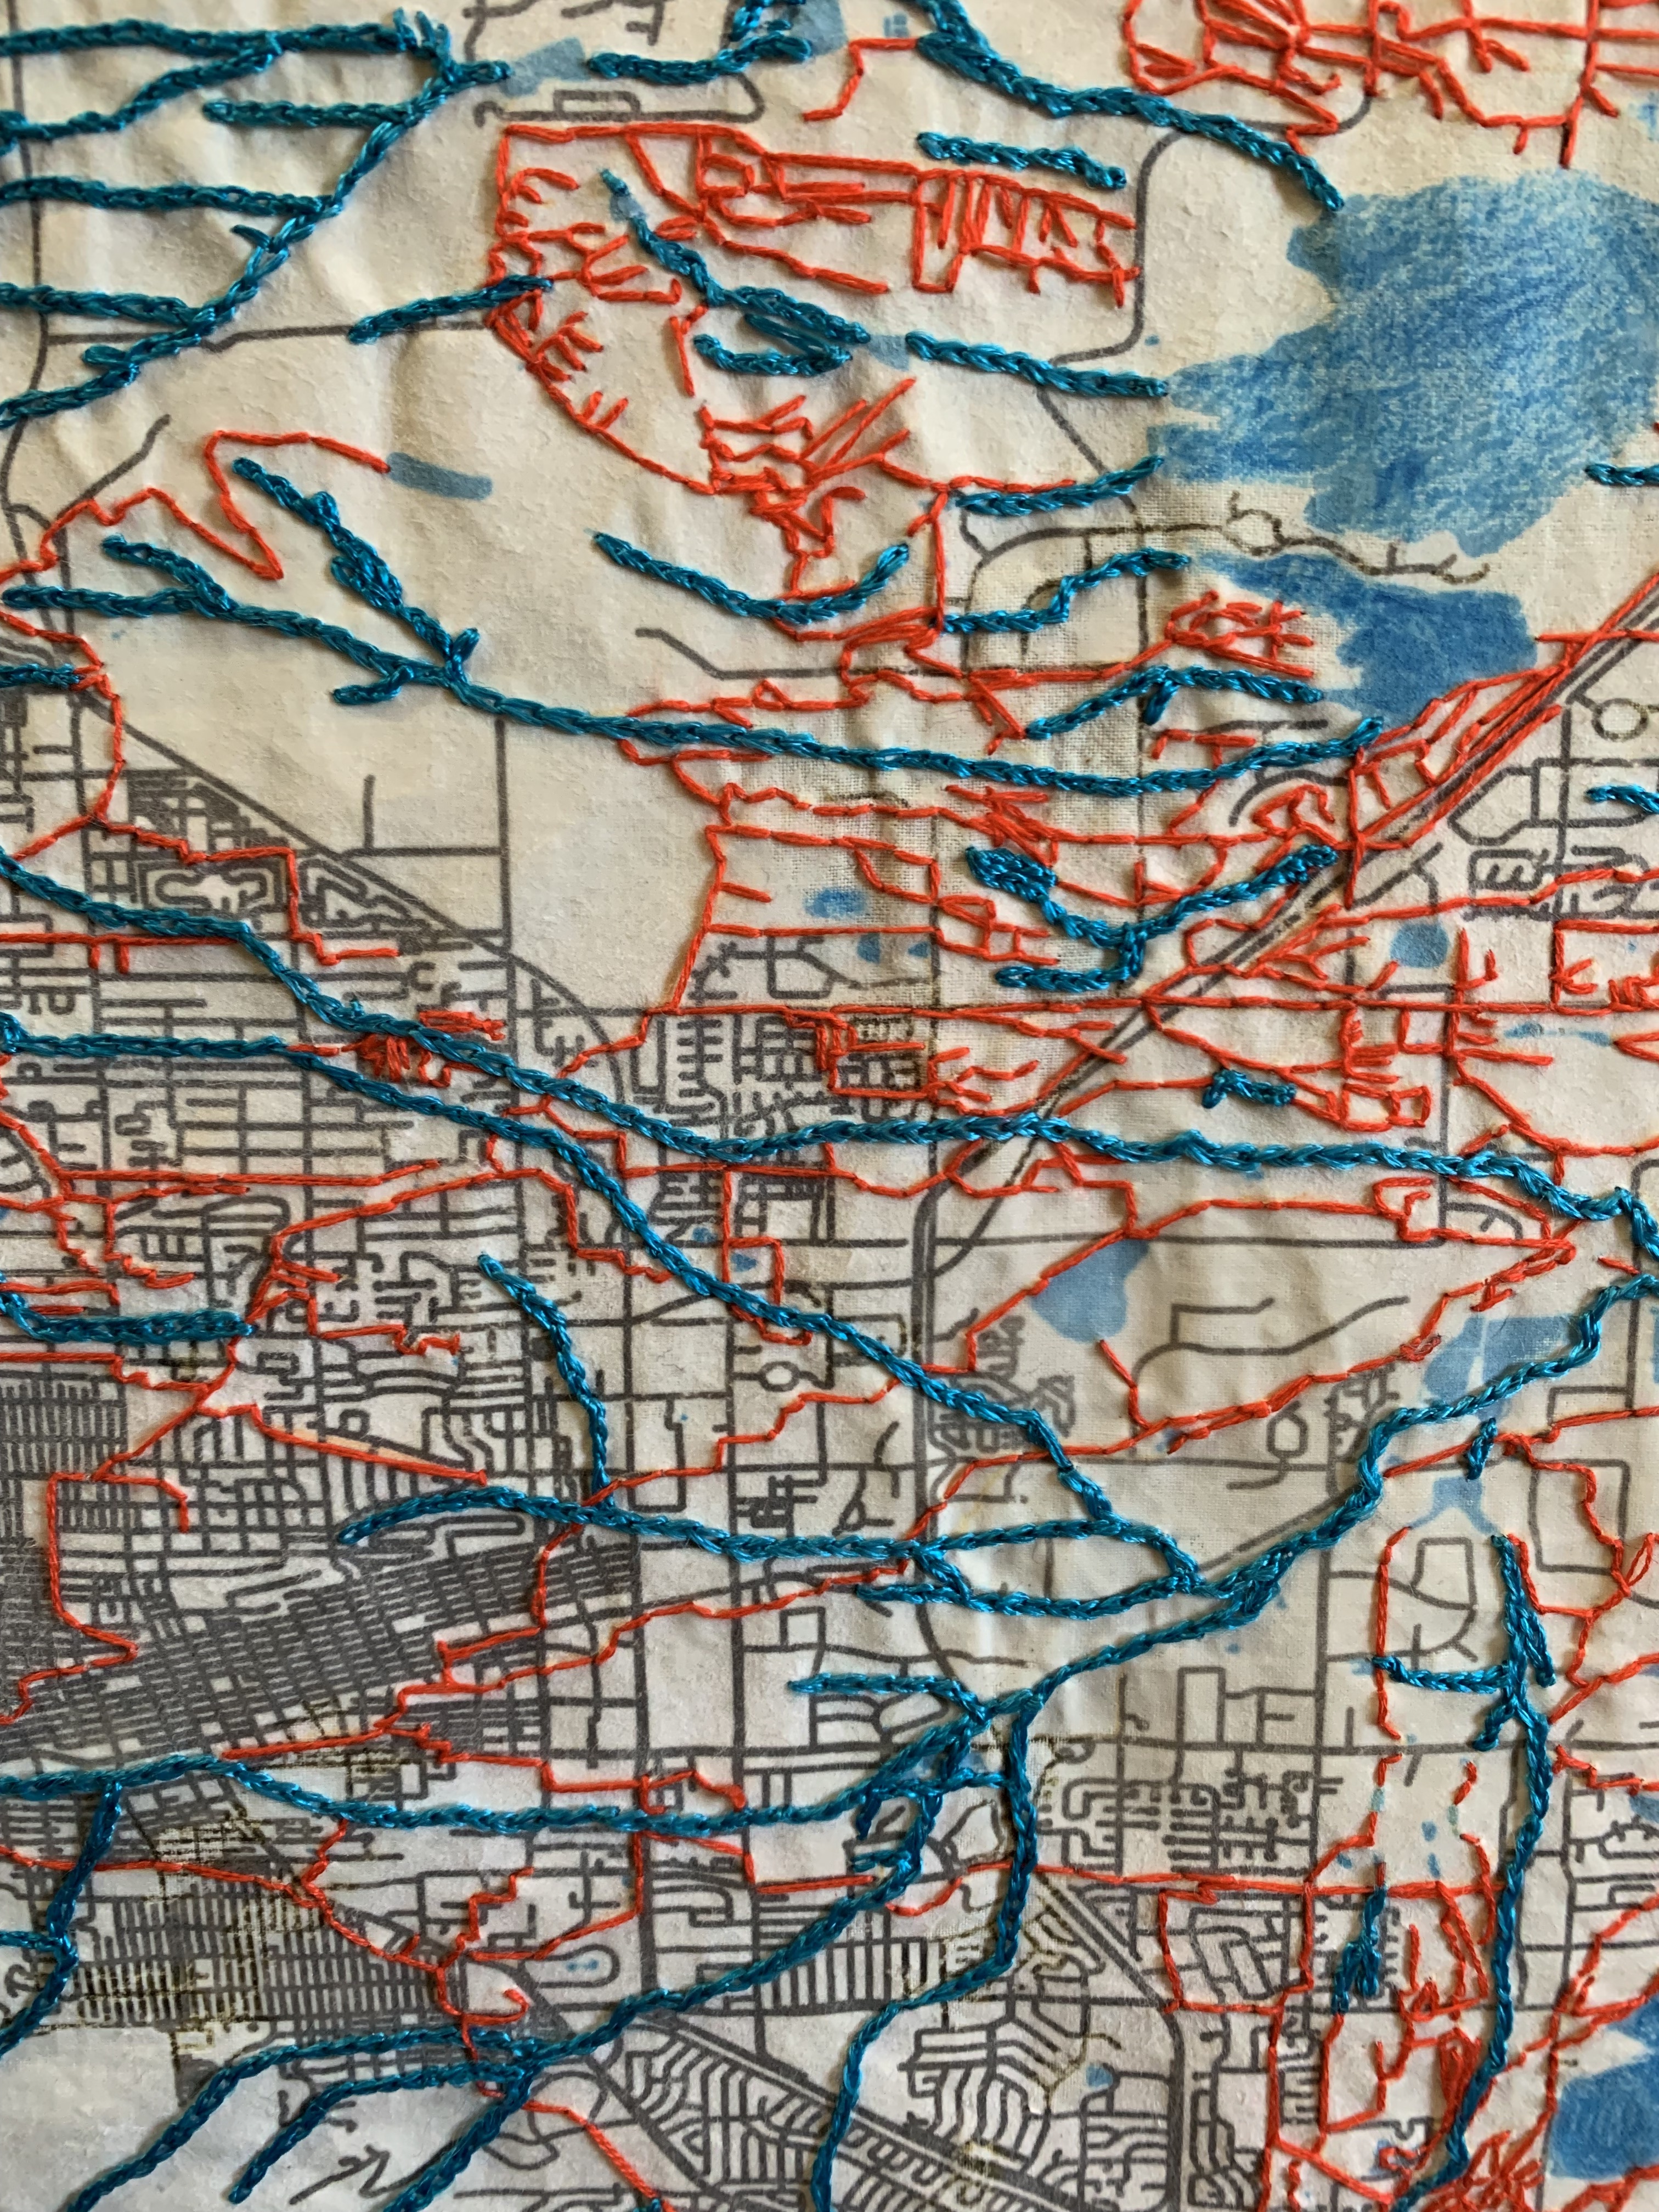
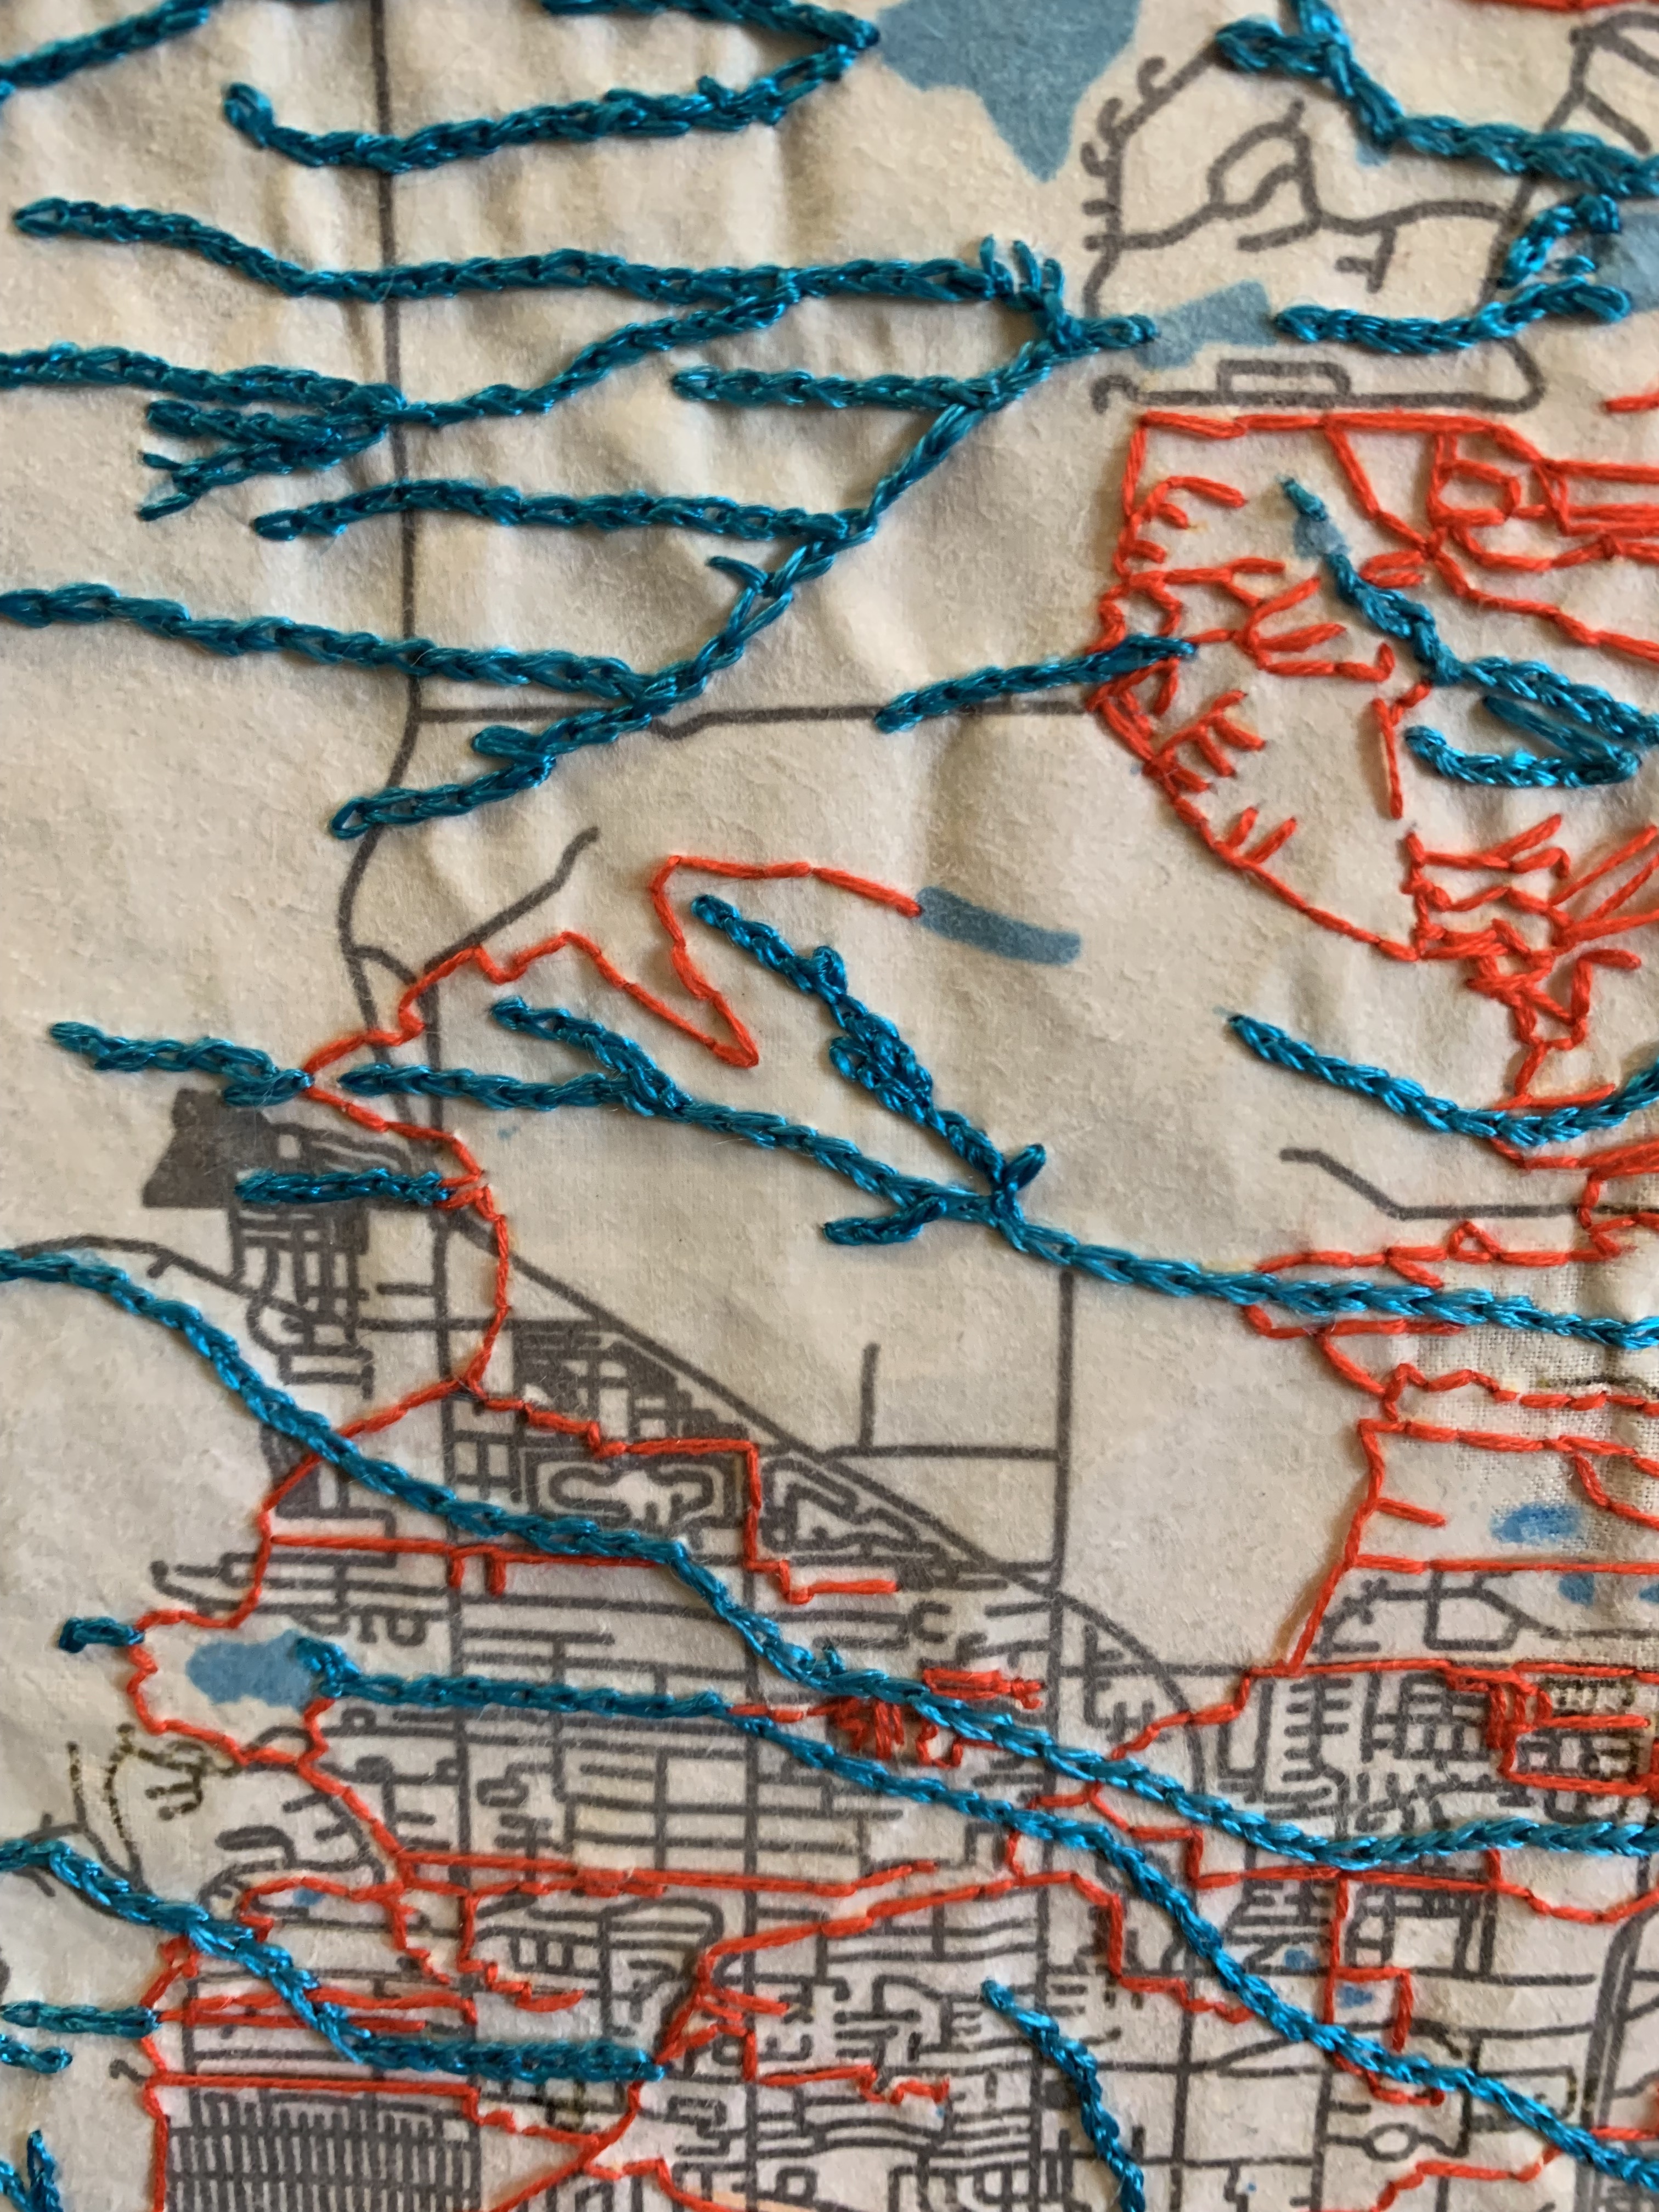
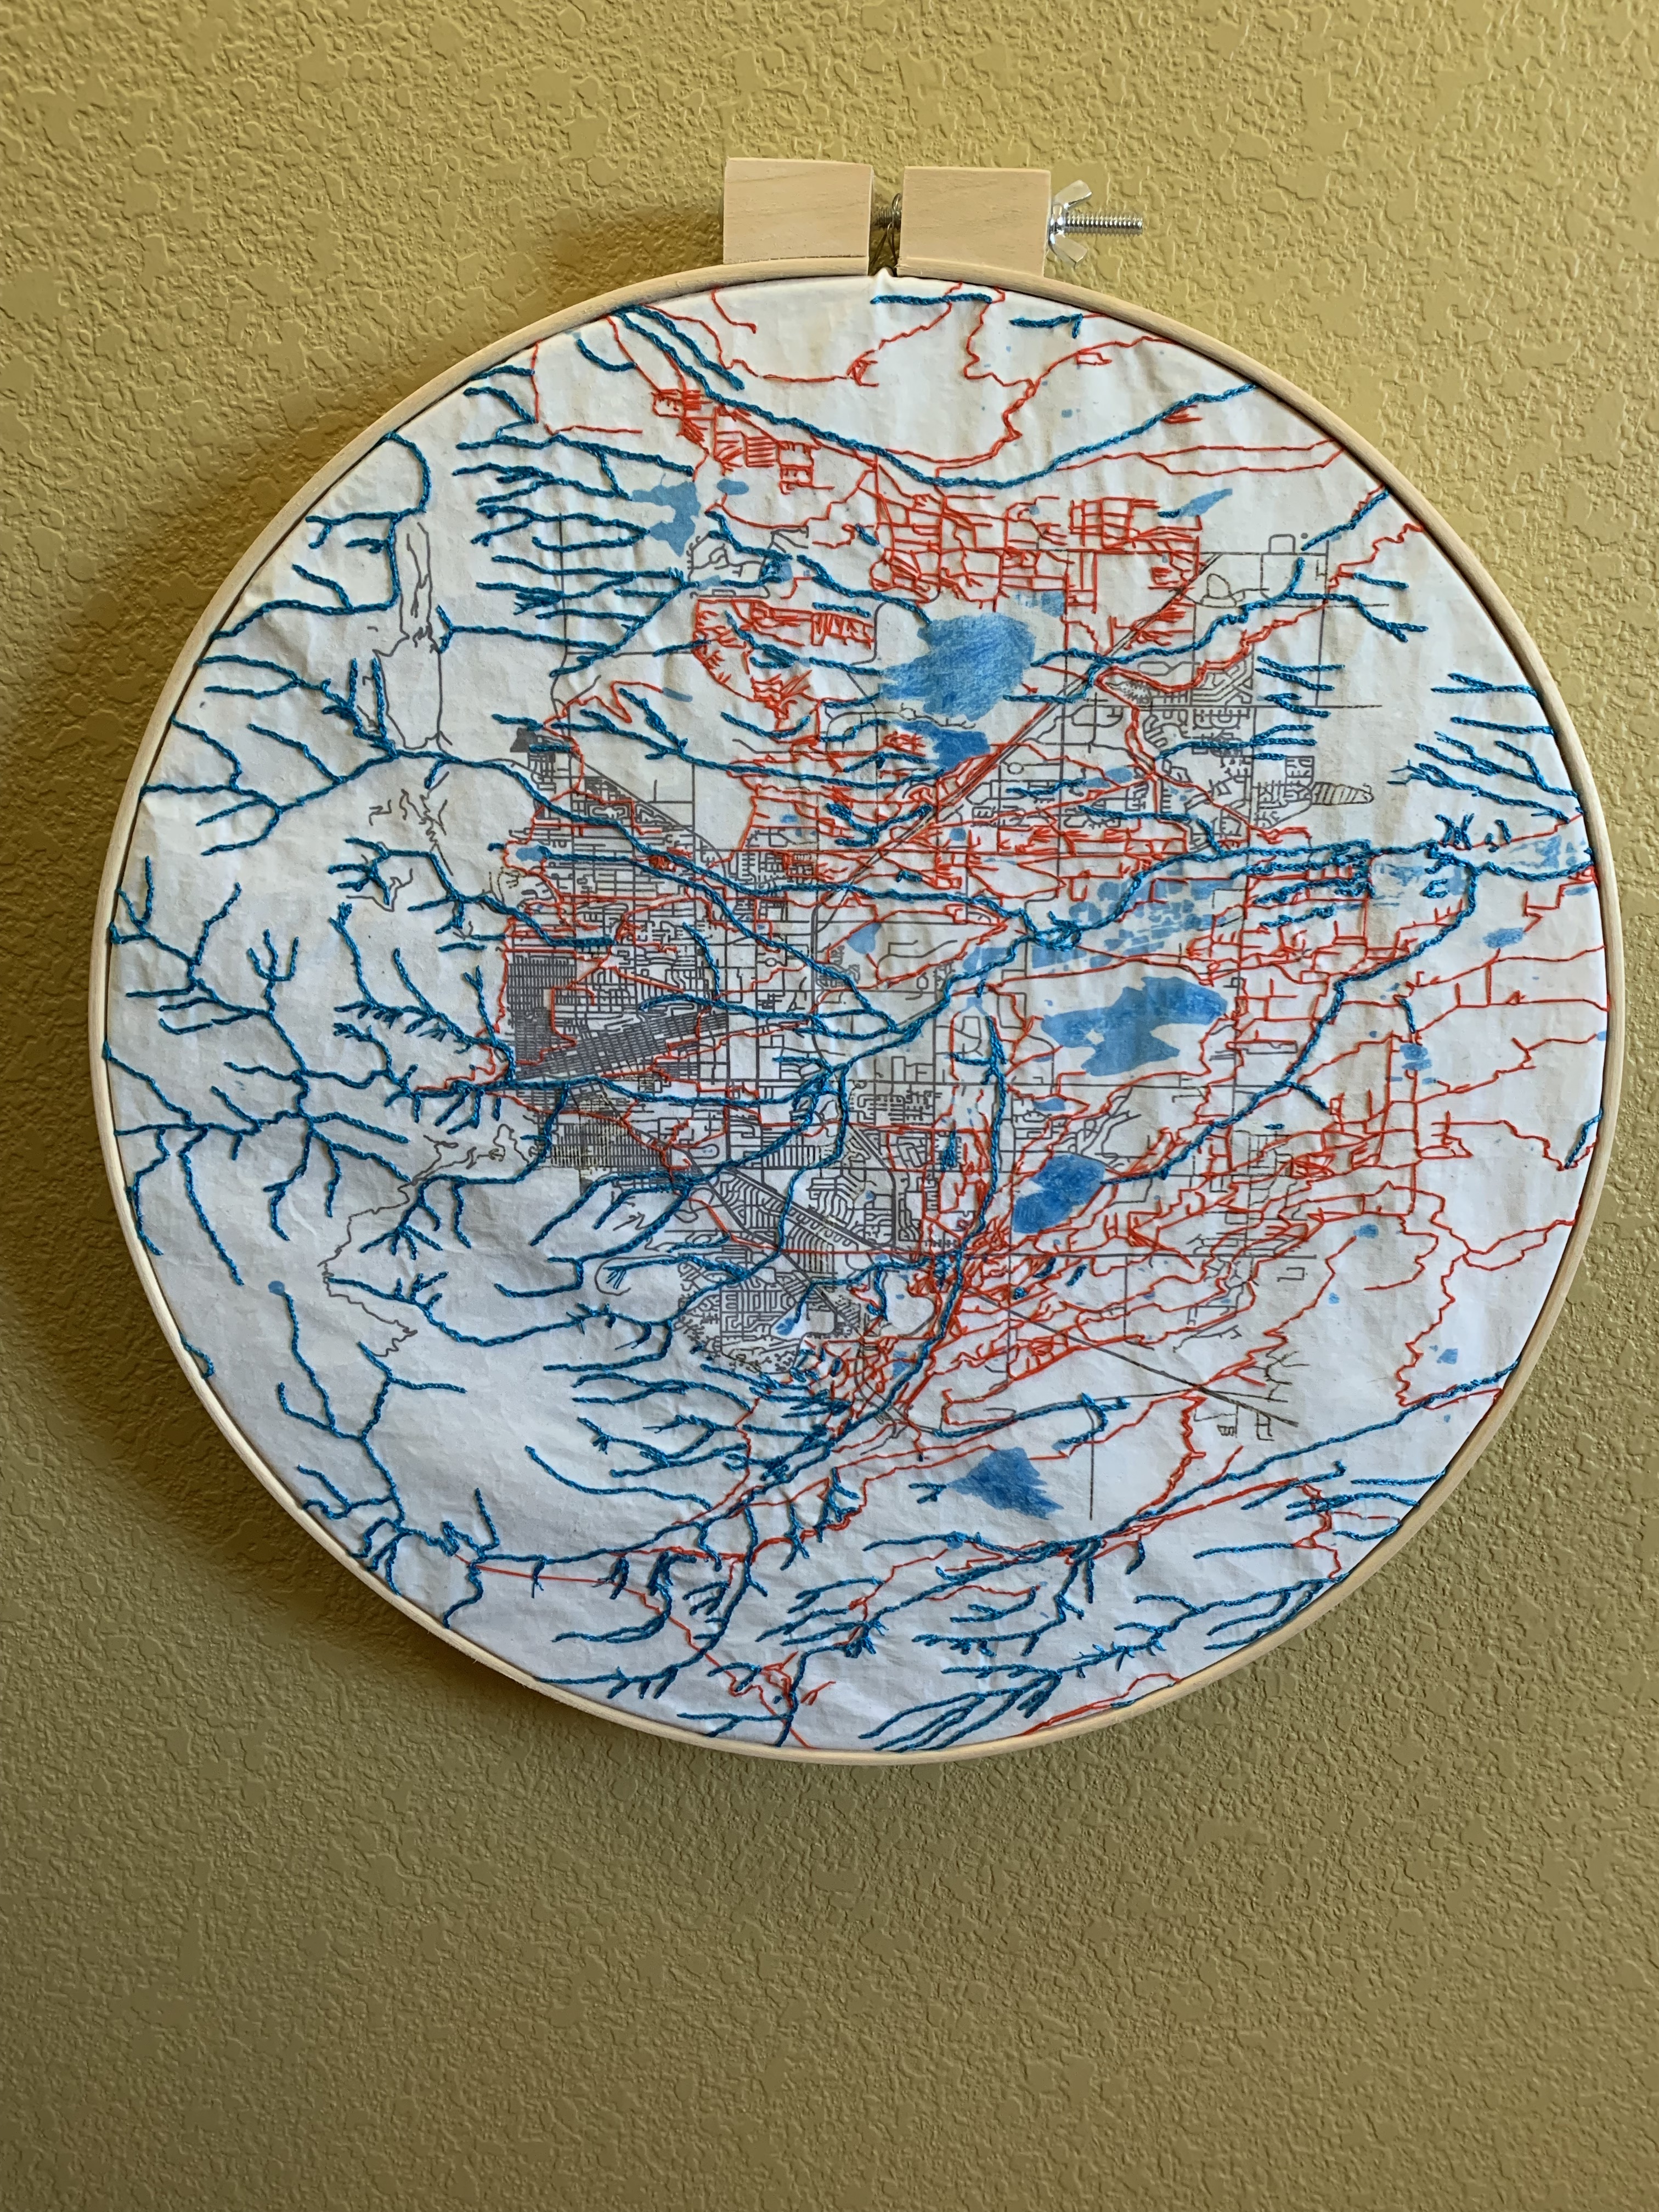
Stitch a Ditch was created for Boulder, Colorado’s 2019 The Art of Data exhibit highlighting Boulder, Colorado’s open data files. The visualization used the city’s hydrology data to create a pattern of ditches and streams that were embroidered in orange back stitch and blue chain stitch, respectively. It shows how much of the hydrologic infrastructure has been engineered as it overlays the geography of streams onto the paths of ditches.
- Project Type: Data Visualization
- Goals and Constraints: Use the city of Boulder, Colorado's open data files to create a piece of art
- Solution: Separate out ditches from streams and highlight each in a different color to show how the hydrology has been engineered.
- Skills used: data processing, svg format manipulation, embroidery