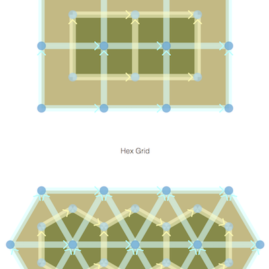
Custom-built SVG graphics that respond to streaming data in real time
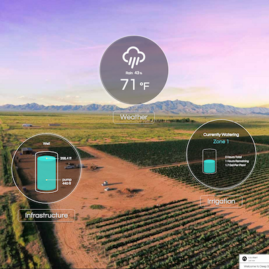
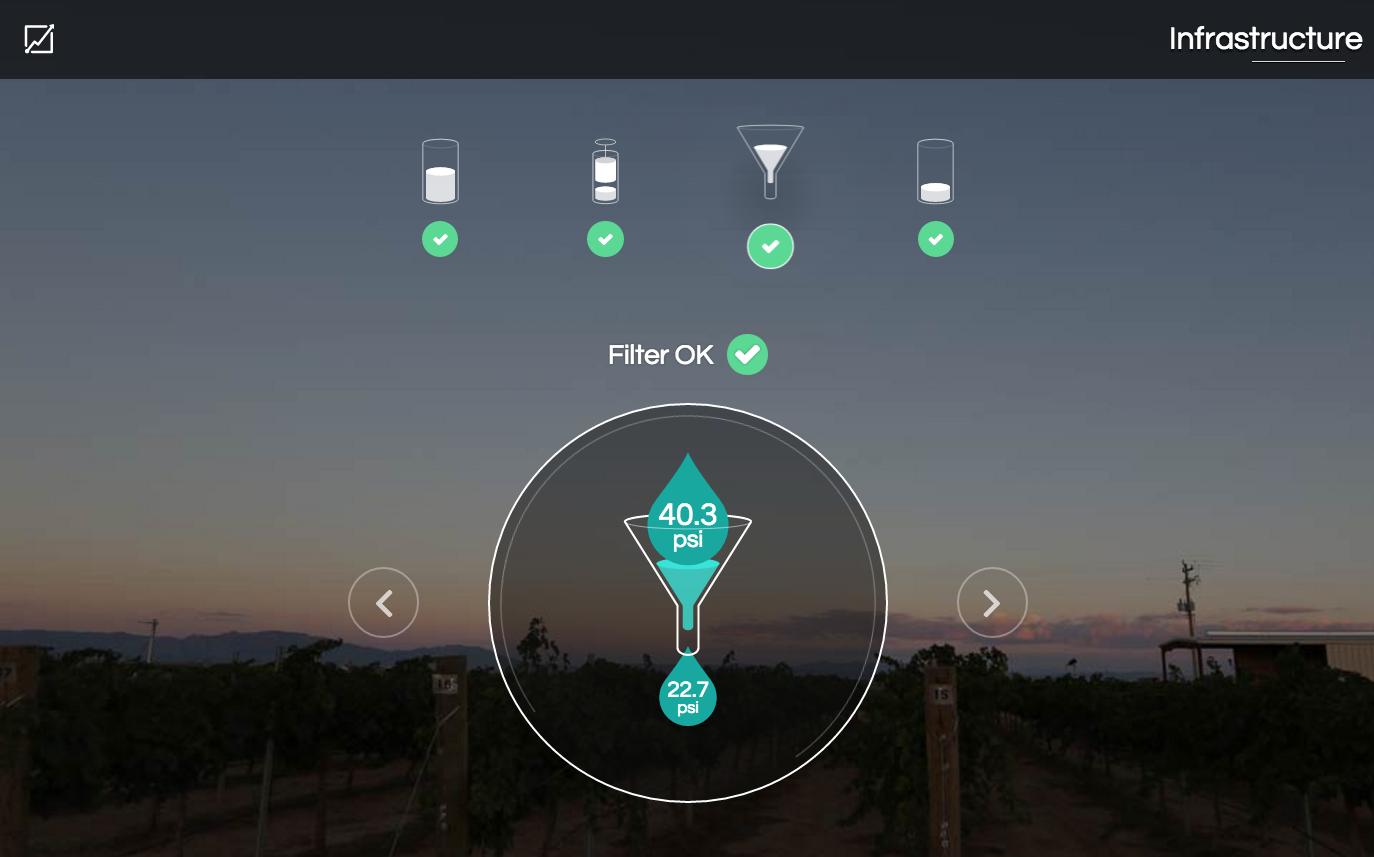
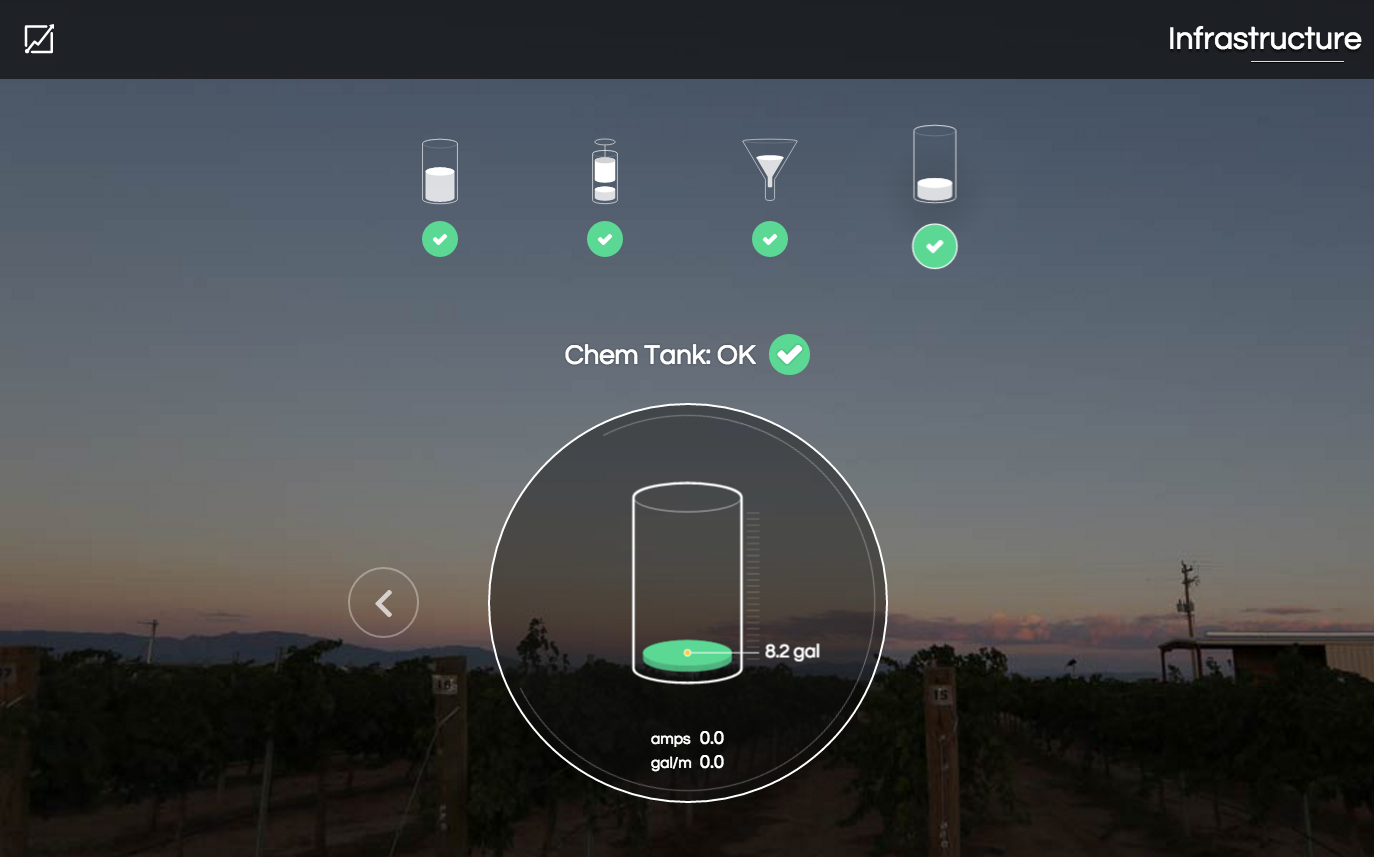
I built custom SVG graphics to represent a well/tank, pump, and filter to render dynamically and change their shape and size in real-time in response to data streaming in from sensors.
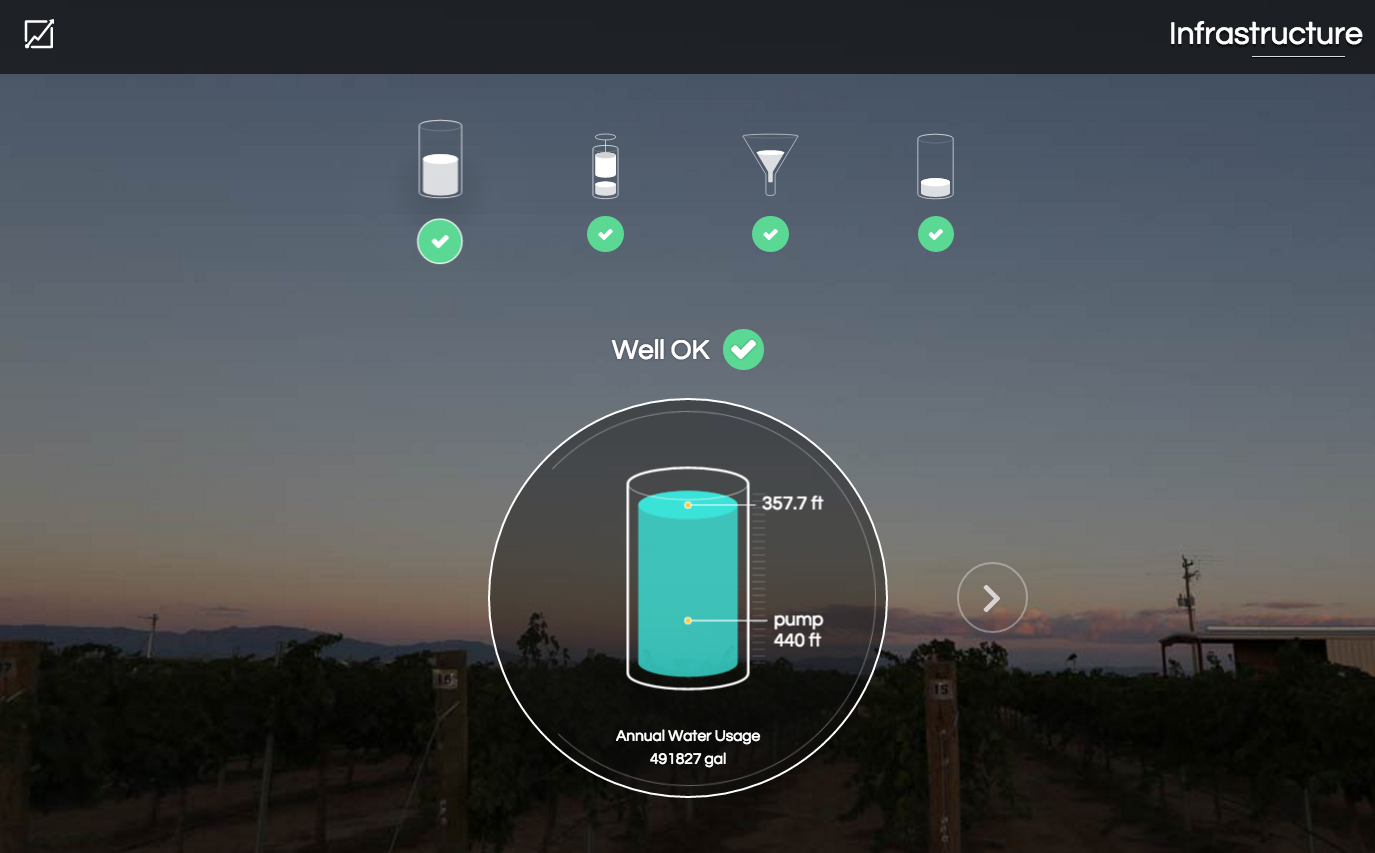
You can watch the well level lower and raise during and after irrigation. The well-water turns yellow when in the danger zone and red in the critical zone.
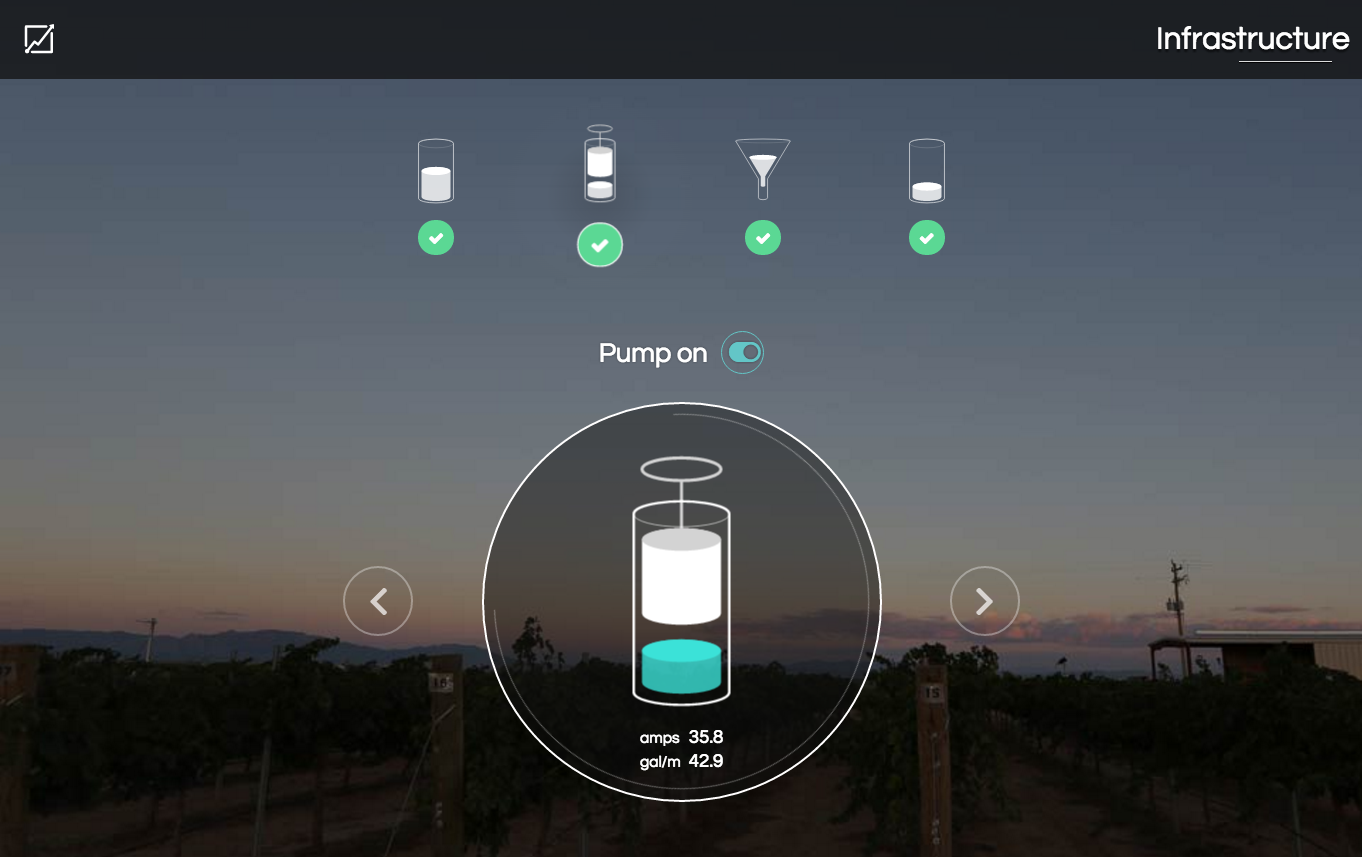
The pump toggles and the water turns blue when the pump is on, white when it is off.
The filter drops scale with the amount of pre- and post-filter pressure and change to a warning color when the filter needs to be changed.
The chem tank fills and empties periodically when it is in use.