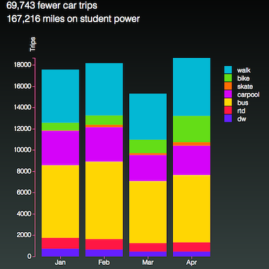
Vineyard management app built using nio, React, and D3.js
This video excerpt shows an automated vineyard app I helped build as part of the team at niolabs. James Holmes was the lead front-end developer and Lilly Sosa was the lead designer.
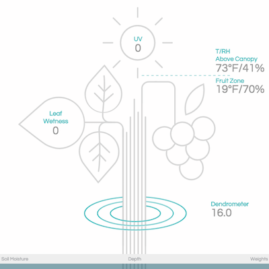
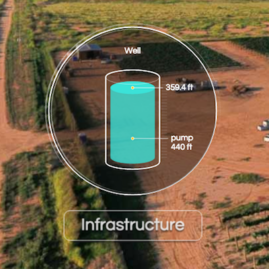
My contributions include the weather page, the reactive infrastructure graphics (well, pump, filter, and chem tank), and the soil moisture graphic with the roots.
The weather page shows multiple reactive icons and tables along with a combined line and area graph with multiple axes.
The infrastructure graphics—well, pump, filter, and tank—are my custom-built SVG functions that respond to streaming data in real time.
The root graphic is a combination of a stacked bar chart and an area graph.
